Description
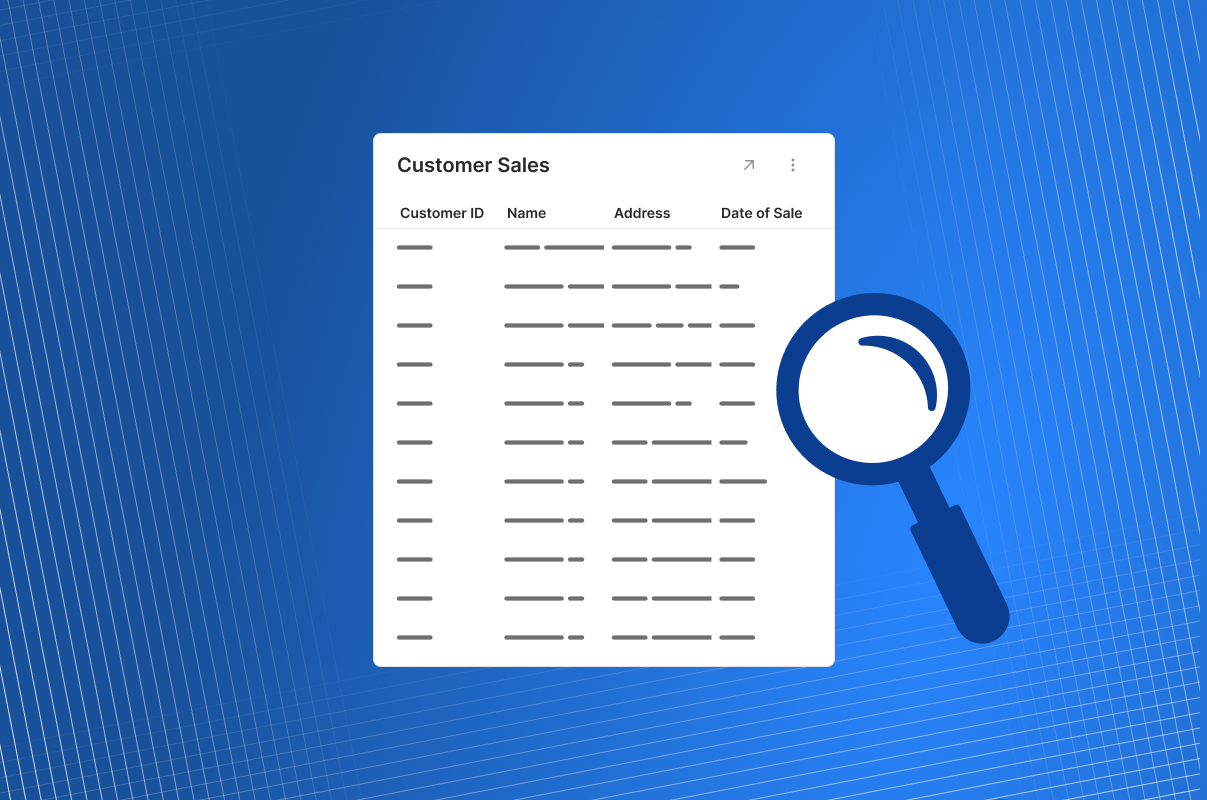
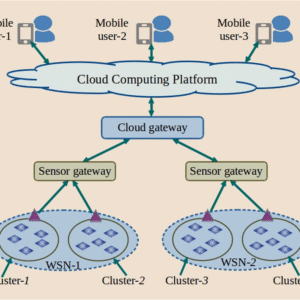
Our Real-Time Simulation Dashboard for Devices/Processes provides a powerful interface for monitoring, simulating, and analyzing the live performance of physical assets or digital processes. Built with technologies like Grafana, Node-RED, Power BI Embedded, or custom React/D3.js interfaces, we connect real-time device streams to a central dashboard that visually simulates behavior, state changes, and performance trends. The system is designed to simulate future scenarios (e.g., failures, overloads) using event-driven simulation engines, backed by historical data and real-time telemetry. We integrate APIs from IoT gateways, cloud platforms (AWS IoT, Azure IoT Hub), or MES/SCADA systems to sync operational data with digital visualizations. The dashboard supports alert systems, KPI overlays, anomaly flagging, and user-based control access. This service is ideal for manufacturing floors, supply chain logistics, and R&D environments where live feedback and test scenario simulation are critical to operational excellence.


Tijani –
The real-time simulation dashboard delivered exactly what we needed. It provides clear, actionable insights into our connected devices, allowing us to proactively address potential issues and fine-tune our processes for optimal efficiency. The visual representation of our operations is intuitive and has significantly improved team collaboration and decision-making. This service has been invaluable in streamlining our operations and improving our overall performance.
Sadia –
The real-time simulation dashboard has revolutionized how we monitor our connected devices. The visual representation of operational status and behaviors allows our teams to proactively identify potential issues and optimize our processes in ways we never thought possible. This has significantly improved our predictive maintenance capabilities and boosted overall efficiency.
Rand –
The real-time simulation dashboard has transformed our operations. We now have an unprecedented level of visibility into our connected devices and processes, allowing us to proactively address potential issues and optimize performance with data-driven decisions. This powerful tool has significantly improved our efficiency and reduced downtime.
Mukaila –
The real-time simulation dashboard has revolutionized our operations. The visual clarity it provides allows our teams to proactively identify potential issues, optimize processes, and ultimately improve efficiency. The insights gained from this dashboard have been invaluable in making data-driven decisions and staying ahead of the curve.